Get insights with Reports
Last updated:
In this guide:
Under Reports, you get an overview and detailed insights into how your charges are used and the revenue generated from users paying for EV charging. For an interactive tutorial, click here.
How to see Reports
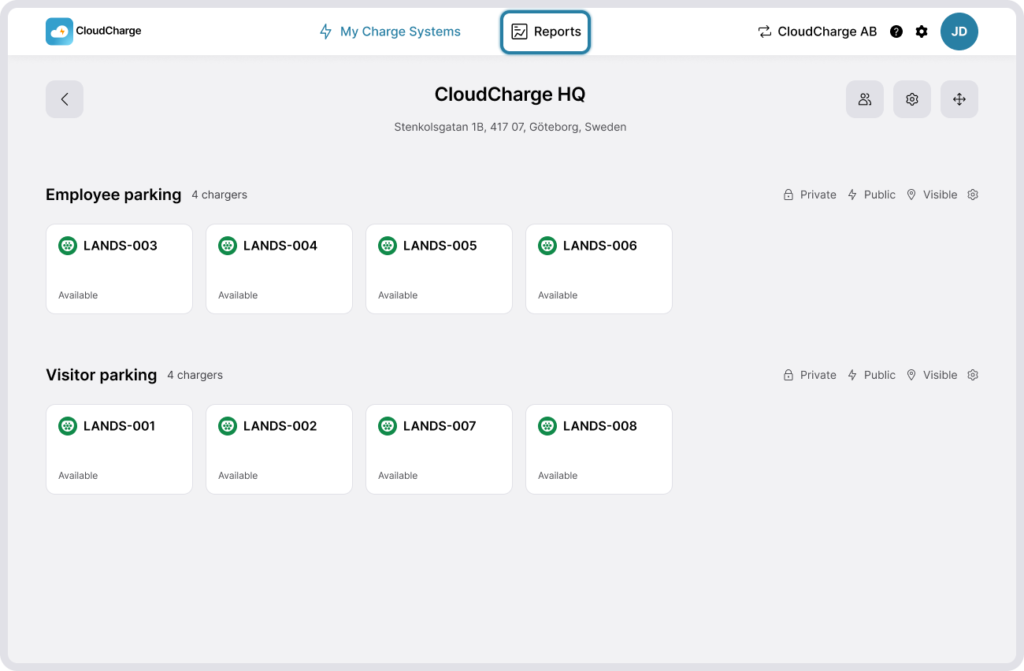
1. Navigate to reports
Click on Reports at the top of the screen.
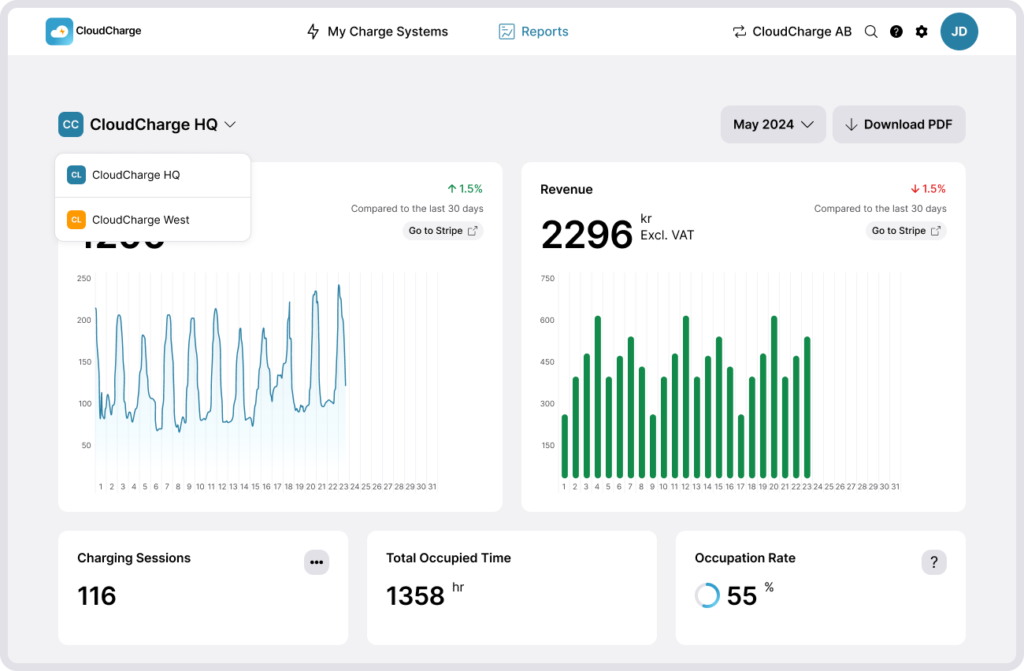
2. Filter
Reports can be filtered by Charge System and month. The graphs and diagrams then provide a daily breakdown for the selected month.

3. See available information and statistics
The statistic and information you can view under Reports are:
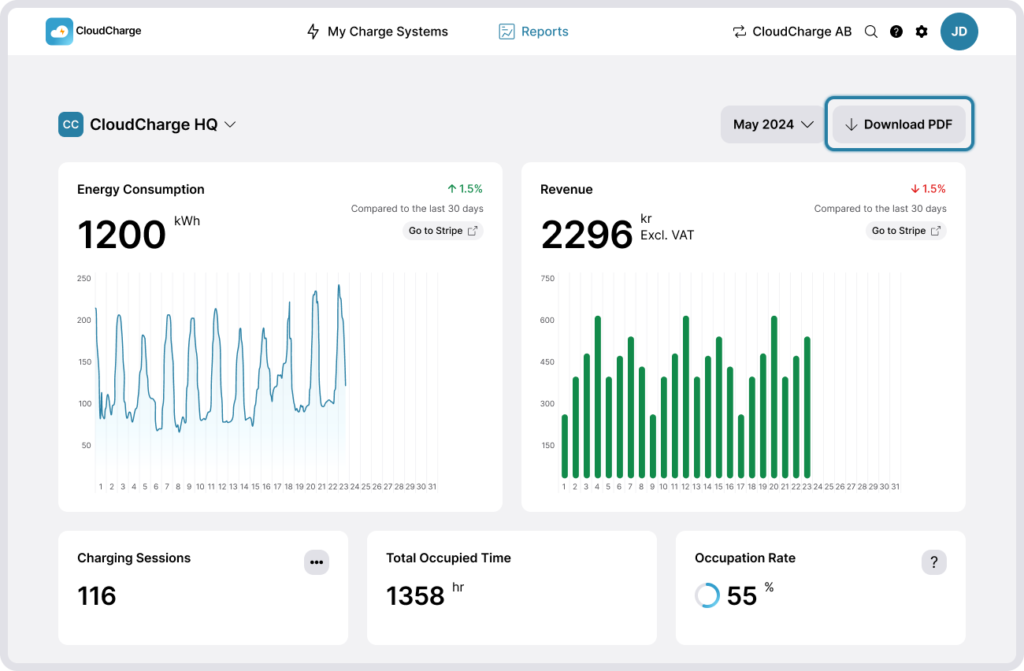
- Energy Consumption
- Revenue: Amount earned from your chargers. For transaction details, go to Stripe. This graph is only available if you’ve enabled receiving payments in CloudCharge. Read more about Receiving payment for EV charging.
- Number of charging sessions: Number of charging sessions in a period. The end date of a charging session determines what month the session belongs to.
- Total Occupied Time
- Occupation rate: Shows how much of the available time your chargers are occupied.
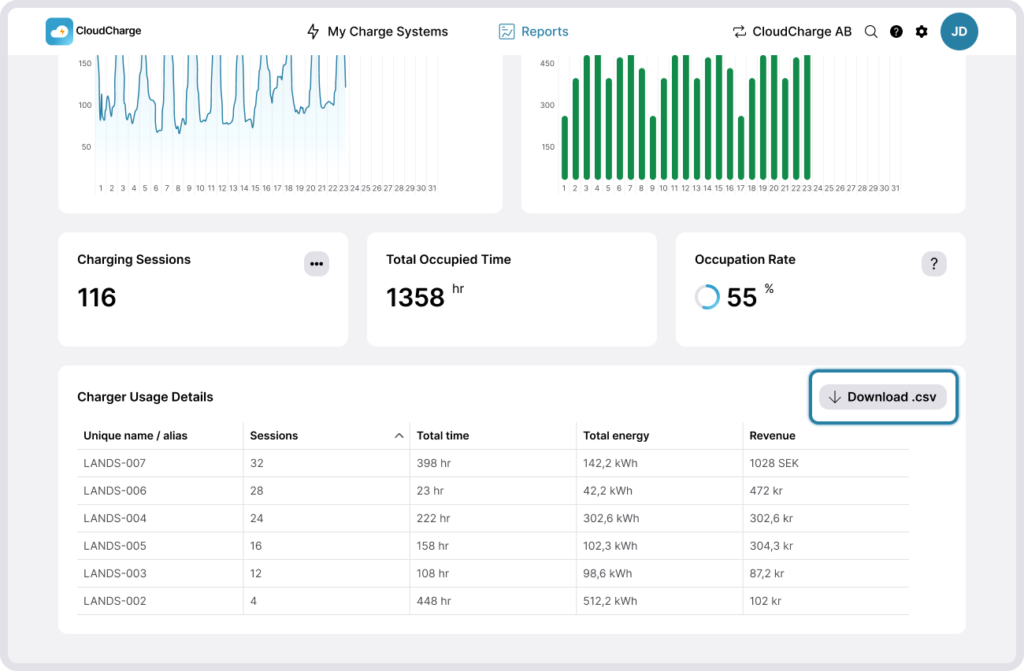
- Charger usage details: A breakdown of each charger, showing total sessions, time, energy and revenue for that specific charger.
It’s also possible to see and download the usage details for each Charger.
Export Reports
The complete report can be downloaded as a PDF file.
You can also download the charger usage details in a comma-separated file (CSV) for analysis in Excel.